Well browser + facets
338,292 wells indexed against Aramco Standard 1.0.0. Search by name, operator, basin, provincia, status. Every hit links to the live /api/storage/v2/records/{id}.
Not a slide deck. A loaded partition you can click through. Wells, trajectories, formation tops, production curves, live telemetry — every record addressable by its canonical OSDU id.
The demo partition is loaded from Argentina's Secretaría de Energía — a public regulator registry, no NDA required to look at it. That gives us a corpus shaped like a real national operator's, not a 20-row test fixture.
has_production — the rest are dry header records, and we surface that distinction in the facet rail instead of hiding it./stats.json.
338,292 wells indexed against Aramco Standard 1.0.0. Search by name, operator, basin, provincia, status. Every hit links to the live /api/storage/v2/records/{id}.
Filter the corpus by what each well actually carries: production (30,142) · well_tops (16,167) · trajectory (1,004) · well_logs (0, on purpose — LAS sits in MinIO). No false positives.
A materializer drains Mosquitto every 5 minutes and writes canonical WellLog records into the partition. Rig signal becomes auditable history without a human re-keying it.
see it →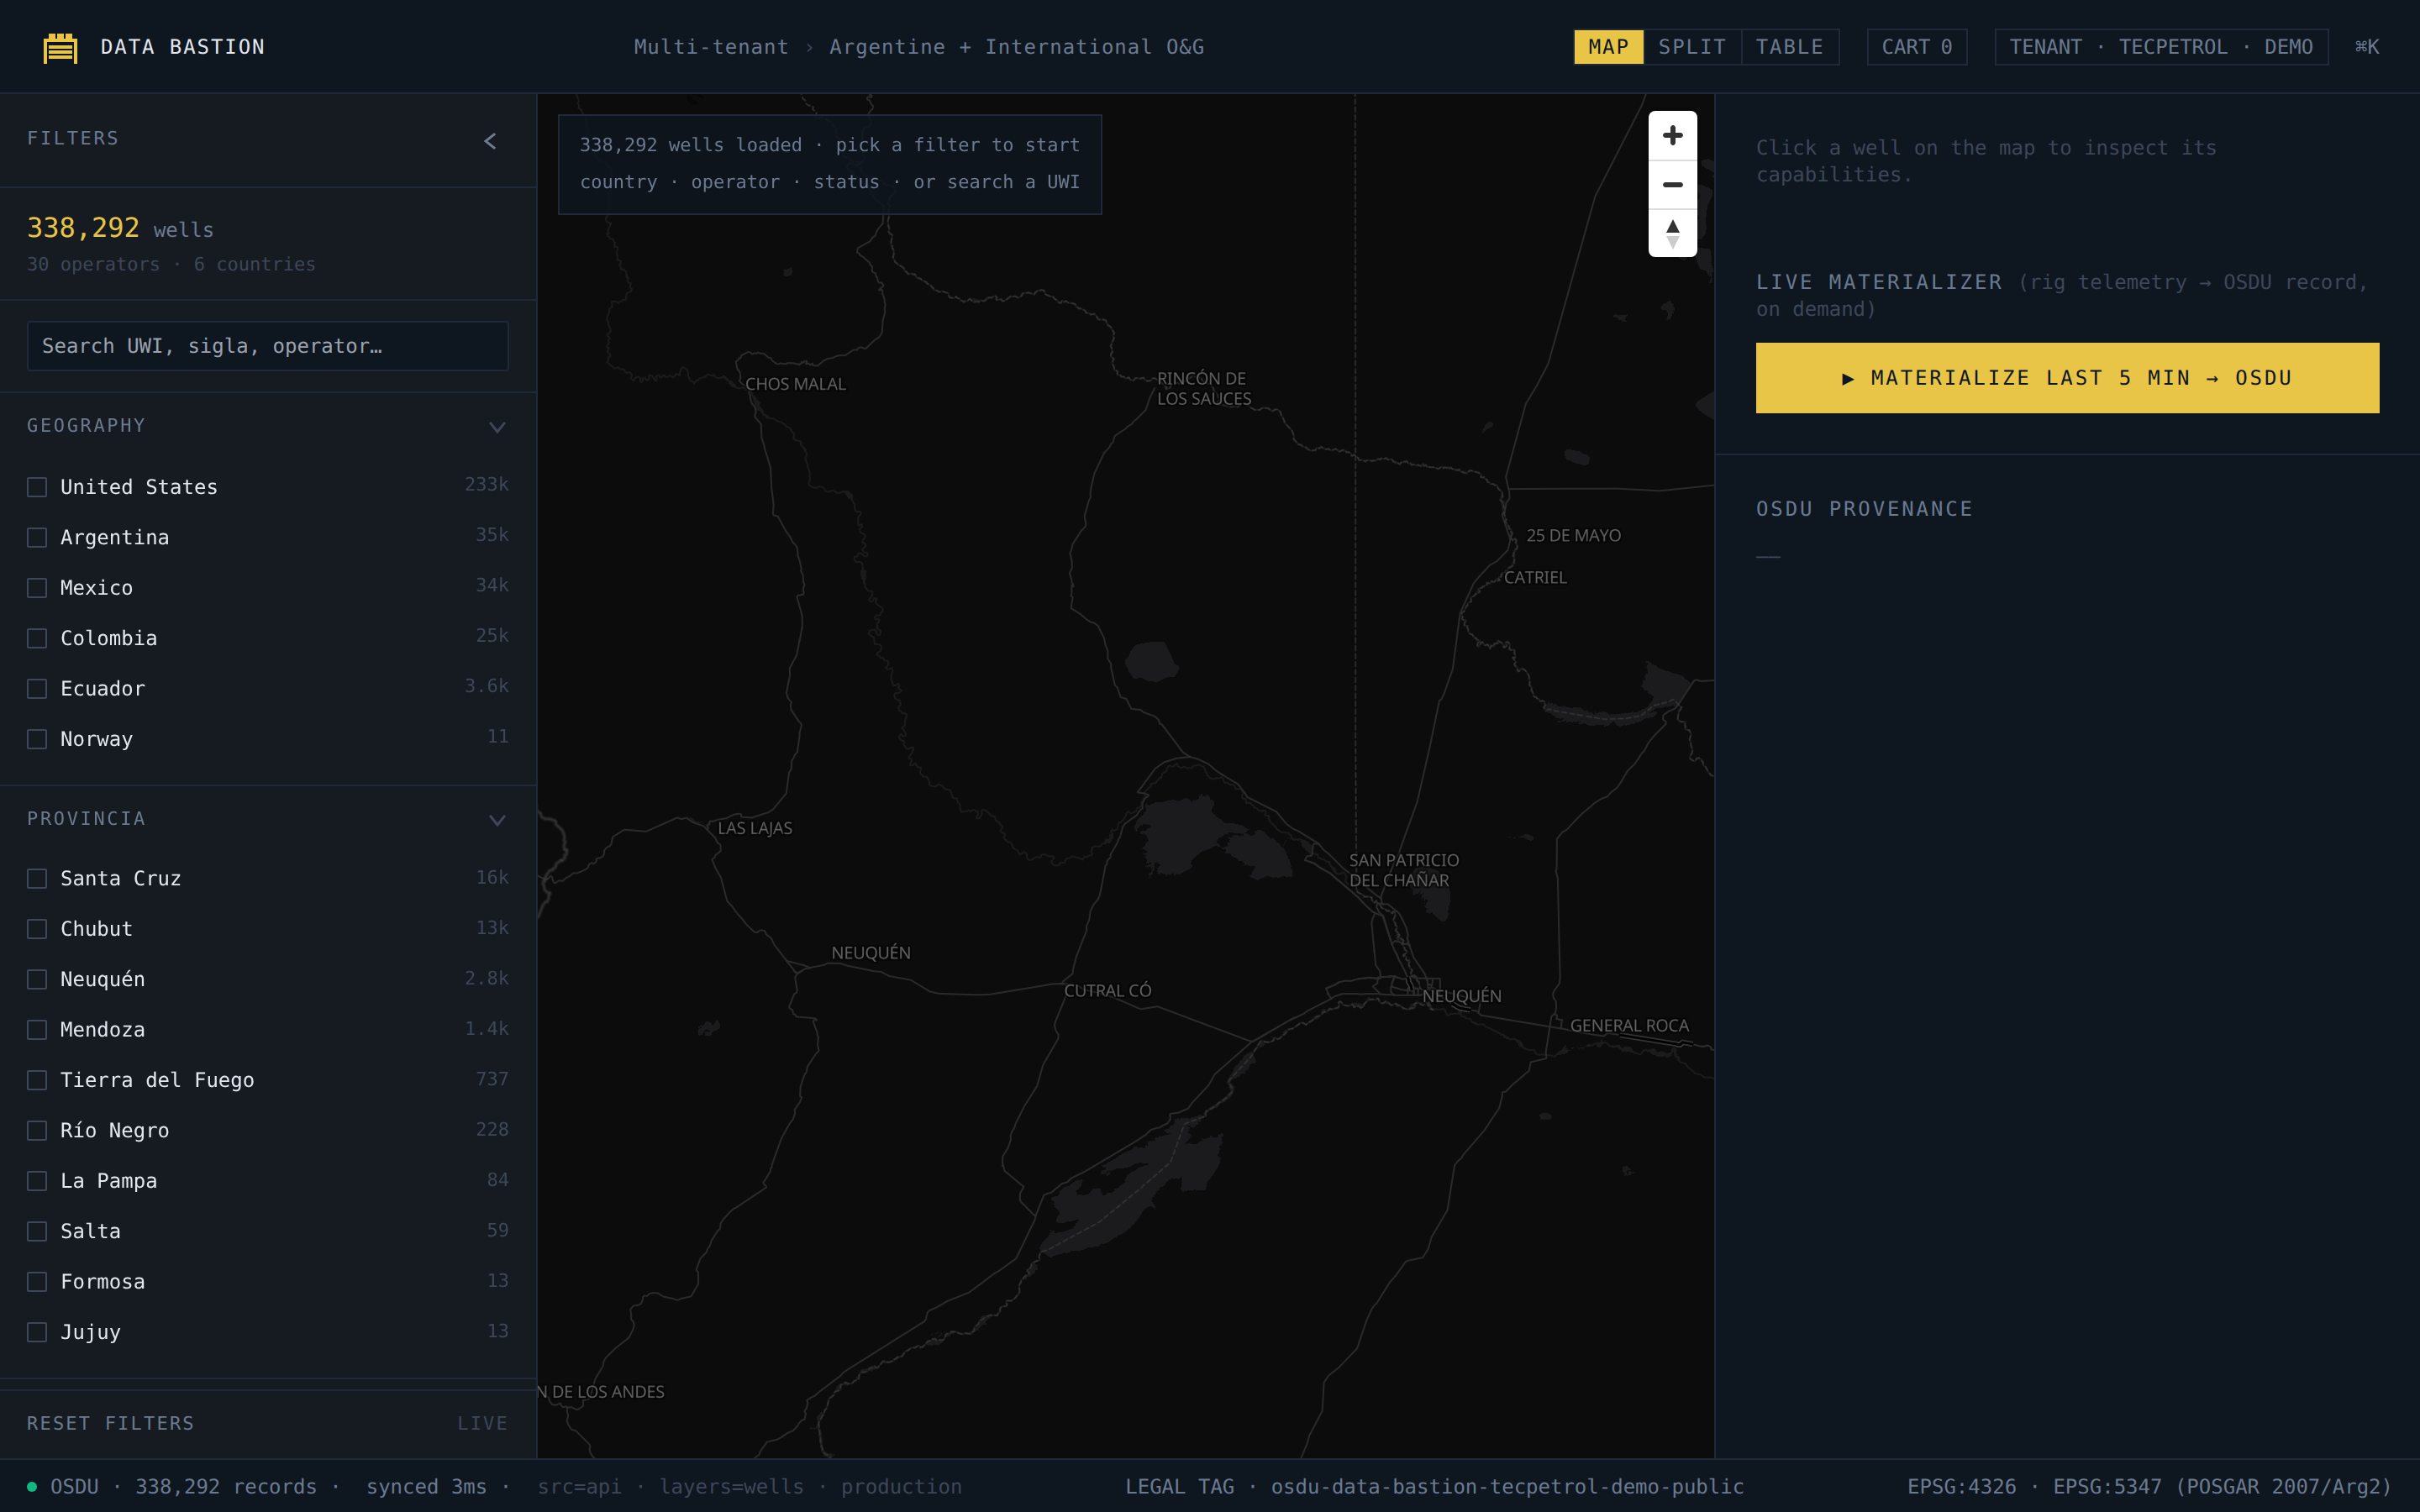
OSDU's value isn't the records — it's that the records relate. Wells own wellbores. Wellbores own trajectories and marker sets. Marker sets reference stratigraphic columns. Break any one of those links and you've got a folder of JSON, not a data platform.
Most “OSDU + IoT” demos stop at a Grafana panel. Ours closes the loop: the same MQTT stream that lights up the dashboard also writes WellLog records into the partition every five minutes.
The pipeline: Mosquitto (MQTT broker, TLS on :8883)
→ Redpanda (the bus) →
TimescaleDB (hot history, queryable per-channel)
→ materializer (cron, 5-minute cadence) →
OSDU WellLog records under your legal tag,
addressable by /api/storage/v2/records/{id} like every
other record in the partition.
53 → 55+ WellLog records and counting in the demo, each one tied back to the exact Timescale window it came from. You can change the cadence, the channels, the legal tag, or turn the materializer off entirely. It's your cluster.
